A pivot table in Excel allows you to create a summary of an existing table by focusing on data that can be used for analysis. Said like that, we don't necessarily understand what it is at first sight, but the purpose of this article is to show you how to create pivot tables in Excel but also and above all to explain to you how they work.

Excel is packed with powerful features that more than justify its status as the most popular spreadsheet. We recently talked to you about the use of the V search and H search functions in Excel. Today, we invite you to discover the PivotTables often abbreviated TDC . We tell you what they are used for in practice and how to create them.
What is a pivot table in Excel?
A pivot table is a summary table that will help the Excel user to analyze a large amount of data in order to obtain information, specific statistics starting from a source table. We will take a specific example to illustrate.
You are the owner of a small business and keep a very simple purchase journal with three (03) columns: the first is that of the dates, the second contains the customer identifiers and the third lists the amount of purchases made by each customer on the date in question. As you can see in the rough example shown in the image below.
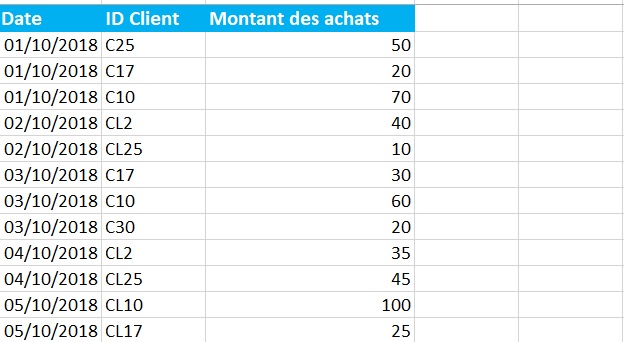
We are going to create a pivot table or TDC which will allow to analyze the data coming from the purchase journal. We will, for illustrative purposes, see the customers who made the most purchases (sum of the amounts) during the period considered.
How to create a pivot table in Excel?
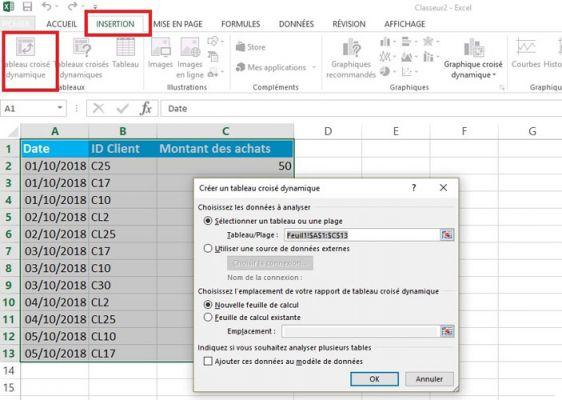
To create a pivot table in Excel, you must first select the range containing the source data to analyze. In this case, we simply select our entire table serving as a purchase log. To go step by step, you need:
- Select the source data range as indicated above
- At the top, in the Excel toolbar, click Insert > Pivot Table
- In the dialog box that opens, click OK leaving the box checked New spreadsheet in order to have the TCD in an external sheet
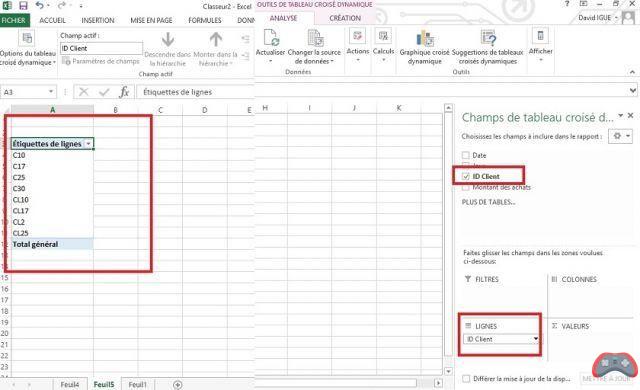
This is the first step in creating the pivot table. It will now be necessary to configure it to display the desired data or statistics. Recall that our objective in this example is to see the total amount of purchases of each customer during the period under consideration. We can do much more complicated with the TDCs but this simple illustration is more digestible to quickly understand how it works.
To the right of the worksheet, we have the fields corresponding to the columns of the source table. We will check the box next to ID Client since it is the reference to which corresponds the information we are looking for. The column title is automatically entered in the part lines on the right, at the bottom and we see the column displaying inside the spreadsheet under the header Line labels.
The value sought is the amount of purchases (the sum) over the period selected in order to see the turnover relating to each of the customers in the source table. We will therefore check the variable Amount of purchases among the available fields at the top right. Excel automatically understands that this field corresponds to the "values" data type and associates customers with the value of their orders.
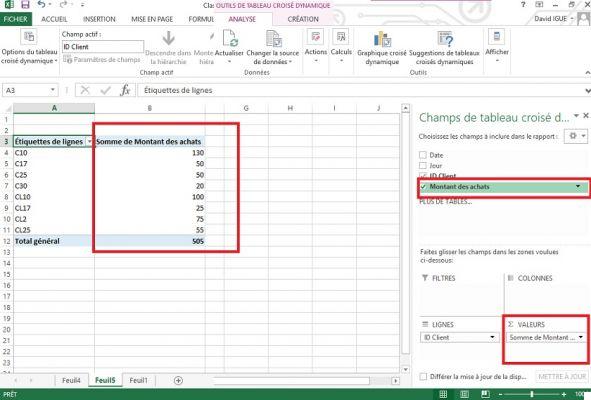
By default, the information displayed in the pivot table is the sum of the purchases, which coincidentally corresponds to what we are looking for. But it is also possible to choose a completely different type of calculation. For example, the average of the order amount and not the sum.
To do this, simply click on the drop-down list in the "Values" section visible in the screenshot above, then on Value Field Properties to select the type of calculation you want. The result is there. Excel shows us the ID of the customers in Row label and the sum of their purchases in value in the next column (image above).
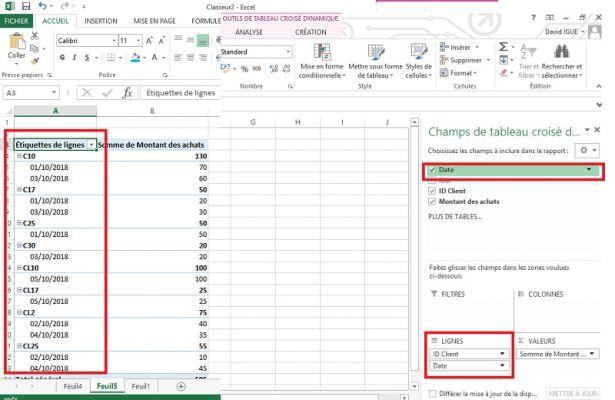
Finally, note that it is also possible to add filters. Example: we are going to add the filter Date to display the value of the sum of the amount of purchases corresponding to a specific date. To do this, we will click in the "Date" box at the top right. By default, the variable will be added to the category Line, which makes it possible to expand the pivot table by detailing the amount of purchases by customer and by date.
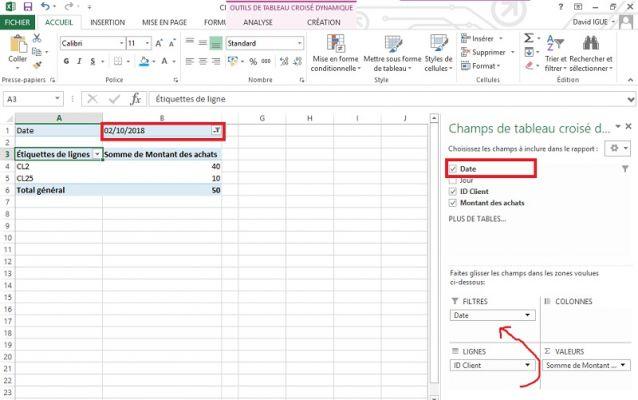
This is already not bad to better analyze the data but what we want is to use the date as a filter in order to have the information: "what is the total amount of purchases of each customer on a specific date" . To do this, simply drag the Date variable and put it in the category of filters. A column is created above the pivot table to allow you to select a specific date. The data displayed in the TDC will correspond to this date.
That's the main thing you need to know about how to create a dynamic table in Excel. For as for all beginners, it may seem complicated at first glance. But do not hesitate to read this article several times if necessary in order to better understand the usefulness and the way of creating TCDs in Excel.
The editorial advises you:
- Excel: how to use the vlookup and hlookup functions